


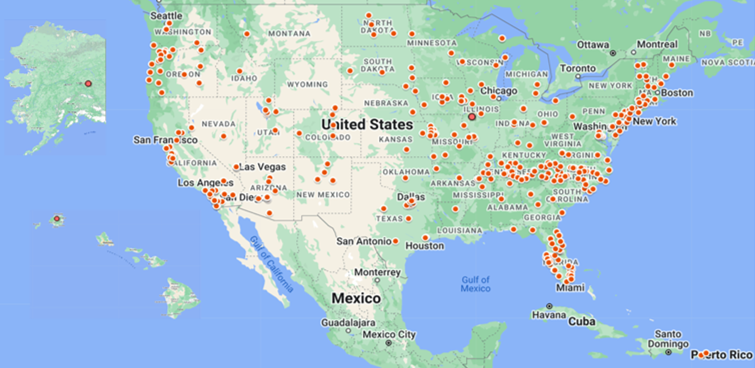
Our national findings are made possible by the data collected from the 373 diverse communities and regions across the country, including 130 cities, 126 counties, 78 multi-county or multi-city regions, 20 states/territories, and 18 cultural districts representing all 50 states and Puerto Rico.
These diverse communities range in population from 4,000 to 4 million and represent rural, suburban, and urban areas. Our national findings are derived from the data from organizations and audiences in these communities. Researchers, with their local and statewide partners, collected surveys from 16,399 organizations and 224,677 attendees to provide a measure of total industry spending.
Americans for the Arts partnered with 297 local, regional, and statewide organizations that represent the 373 study regions. Forty-one research partners represented multiple communities such as both a city and a county.
To participate in AEP6, the 297 local and statewide research partners agreed to four participation criteria.
1. Identify and code the comprehensive universe of eligible arts and culture organizations located in their study region.Arts & Economic Prosperity 6 demonstrates that the nonprofit arts and culture industry is an economic driver in communities—a growth industry that supports jobs, generates government revenue, and builds community vibrancy. The map below displays the 373 study regions who participated in this research effort.
Definitions:
Total Expenditures:
The total dollars spent by your nonprofit arts and cultural organization and its audiences; event-related spending by cultural audiences is estimated using the average dollars spent per person, per event by cultural attendees in similarly populated communities.
FTE Jobs:
The total number of full-time equivalent (FTE) jobs in your community that are supported by the expenditures made by your arts and cultural organization and/or its audiences. An FTE job can be one full-time employee, two half-time employees, etc. Economists measure FTE jobs, not the total number of employees, because it is a more accurate measure that accounts for part-time employment.
Household Income:
The total dollars paid to community residents as a result of the expenditures made by your arts and cultural organization and/or its audiences. Household income includes salaries, wages, and entrepreneurial income paid to residents. It is the money residents earn and use to pay for food, shelter, utilities, and other living expenses.
Government Revenue:
The total dollars received by your local and state governments as a result of the expenditures made by your arts and cultural organization and/or its audiences. Government revenue includes revenue from local and state taxes (e.g., income, sales, lodging, real estate, personal property, and other local option taxes) as well as funds from license fees, utility fees, filing fees, and other similar sources. Local government revenue includes funds to governmental units such as city, county, township, and school districts, and other special districts.
When using estimates derived from this calculator, always keep the following caveats in mind: (1) the results of this analysis are based upon the averages of similarly populated communities, (2) a unique input-output model was customized for each of these similarly populated communities, providing very specific employment, household income, and government revenue data, and (3) your results are therefore estimates, and should not be used as a substitute for conducting an economic impact study that is customized for your community.
| Total Expenditures | Jobs | Household Income | Local Government Revenue | State Government Revenue | Federal Gov Tax Revenue | |
|---|---|---|---|---|---|---|
| Organization(s): | ||||||
| Audiences: | ||||||
| Total: |
Want to know more about how the study was conducted? Questions about the methodology?
Read our FAQ page to find the answers to our most frequently asked questions about Arts & Economic Prosperity 6.


